

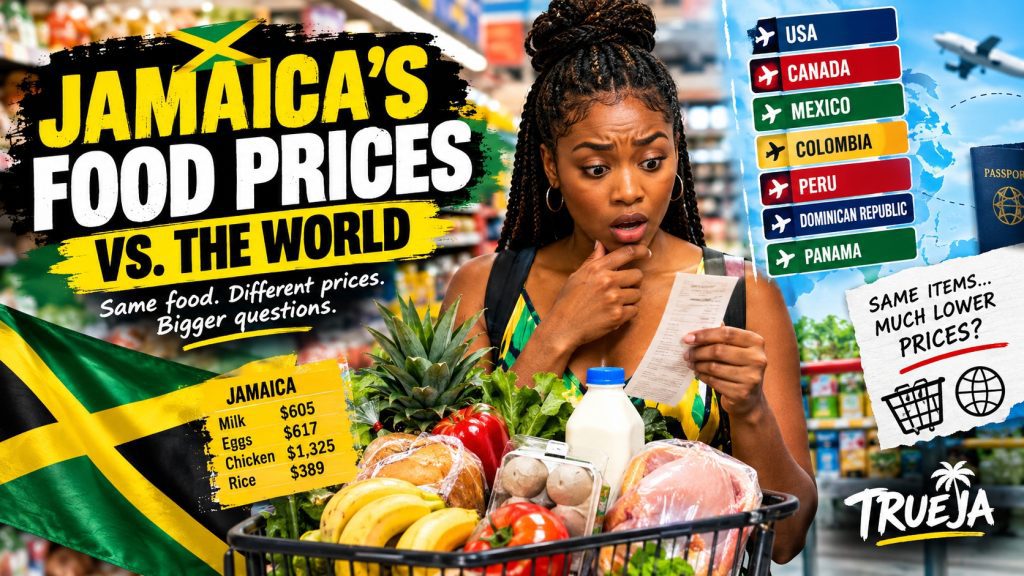
There is a particular kind of sticker shock that can happen when a Jamaican travels overseas for the first time and sees how Jamaica’s food prices compare with what they are paying abroad.
It is something Jamaicans have been talking about for years.
A person goes to a supermarket in Colombia, Mexico, Panama, Peru or the Dominican Republic and suddenly starts comparing the price of milk, eggs, chicken, fruit, rice and other everyday items with what they normally pay at home.
Some Jamaican travellers have even documented those comparisons online, showing supermarket receipts, shelf prices and everyday meals.
That kind of firsthand experience matters.
If you were born and raised in Jamaica, you already have a mental reference point for what groceries normally cost. When you travel somewhere else and see similar products selling for noticeably less, the difference can be difficult to ignore.
But personal experience is not the same thing as scientific evidence.
Prices vary between supermarkets, cities, brands, neighbourhoods and even individual weeks.
So TrueJa decided to take a deeper look.
How expensive is food in Jamaica compared with other countries?
And perhaps more importantly, how expensive is it relative to what people actually earn?
First, What Are We Actually Comparing?
There is no single number that can answer whether food is expensive.
One country may have cheaper chicken but more expensive milk. Another may have cheaper fruit but higher prices for beef.
That is why this comparison looks at several different measurements instead of relying on one headline figure.
We look at:
- Grocery price indexes
- Individual everyday food items
- A standardized minimum food basket
- Food costs compared with minimum wages
- Food costs compared with average take-home salaries
- The experience of Jamaican travellers
- Why food can be cheaper in countries that also produce similar agricultural products
The main comparison countries are Colombia, Panama, Peru, the Dominican Republic and Mexico, along with the United States and Canada as major international benchmarks.
For the broad grocery-index comparison, the figures come from the 2026 mid-year international dataset. Individual food prices and the standardized food basket use the latest 2026 country-level data available.
Metric One: Jamaica’s Grocery Prices Compared With the World
Let’s start with the broadest measurement.
The grocery index is designed to compare the relative price level of groceries between countries.
Using the 2026 mid-year comparison, Jamaica’s grocery index was 68.64.
That puts Jamaica below the United States and Canada, but well above several of the Latin American and Caribbean countries that Jamaicans commonly compare their shopping experiences with.
| Country | Groceries Index |
|---|---|
| United States | 76.38 |
| Canada | 69.18 |
| Jamaica | 68.64 |
| Panama | 51.26 |
| Mexico | 46.62 |
| Dominican Republic | 38.90 |
| Peru | 37.68 |
| Colombia | 32.78 |
Grocery Price Index
Higher index = higher relative grocery prices. This is an index, not a percentage of income.
The first thing that stands out is Jamaica’s position.
Jamaica’s grocery index is roughly 33% higher than Panama’s, about 47% higher than Mexico’s, more than 76% higher than the Dominican Republic’s, and more than 109% higher than Colombia’s.
That does not mean every grocery item in Jamaica costs more than the equivalent item in those countries.
It means the overall grocery price environment is considerably higher in the index.
Metric Two: The Individual Items That Make Jamaicans Look Twice
This is where the comparison becomes more familiar.
Instead of looking at an index, let’s look at the actual items people put into shopping carts.
Current Jamaica figures include approximately:
| Item | Jamaica |
|---|---|
| Milk, 1 litre | J$604.91 |
| White bread, 1 lb | J$476.17 |
| Rice, 1 lb | J$115.43 |
| Eggs, 12 | J$617.38 |
| Chicken fillets, 1 kg | J$1,325.04 |
| Beef, 1 kg | J$1,374.68 |
| Apples, 1 kg | J$1,034.85 |
| Bananas, 1 kg | J$585.13 |
| Oranges, 1 kg | J$783.04 |
| Tomatoes, 1 kg | J$414.62 |
| Potatoes, 1 kg | J$444.08 |
| Onions, 1 kg | J$397.10 |
Selected Food Prices in Jamaica
There are some important surprises here.
Jamaica is not automatically more expensive for every product.
In the United States and Canada, for example, certain meats can cost more in absolute terms than their Jamaican equivalents.
That is why cherry-picking one product can produce almost any conclusion you want.
If someone says, “Chicken is cheaper in Jamaica,” that can be true for a particular market or product.
If another person says, “Fruit is much cheaper overseas,” that can also be true.
The broader basket is what tells us whether those individual differences add up to a meaningful overall gap.
Metric Three: What Does a Standardized Food Basket Cost?
This is where the comparison becomes more useful.
The international food-price database used for this analysis calculates a recommended minimum food budget using a standardized basket of everyday foods.
There is an important technical note here: the database’s general food-prices page currently describes its recommended minimum as being based on a 2,300-calorie diet, while the individual country food-price pages currently label the displayed Western-food basket as 2,400 calories.
Because of that inconsistency, this article does not attach a calorie figure to the comparison. We refer to it simply as the standardized recommended minimum Western-food basket.
That is the safer and more accurate way to present the data.
| Country | Monthly Food Basket |
|---|---|
| Jamaica | J$62,340.71 |
| Colombia | Col$846,516.58 |
| Peru | S/692.91 |
| Panama | US$324.30 |
| Mexico | Mex$5,012.36 |
| Dominican Republic | RD$13,310.18 |
| United States | US$430.21 |
| Canada | C$534.48 |
Monthly Standardized Food Requirement
The currencies are different, so the bar lengths above are illustrative only. The income-burden percentages are the meaningful cross-country comparison.
The raw numbers cannot simply be placed side by side because one Jamaican dollar is not equal to one Mexican peso, Colombian peso or Peruvian sol.
The real question is what happens when we put those food costs against local incomes.
Metric Four: What Does Jamaica’s Food Bill Look Like Against Minimum Wage?
This is where the comparison becomes much more serious.
Jamaica’s national minimum wage increased to J$17,000 per 40-hour work week on July 1, 2026.
That works out to a monthly equivalent of approximately J$73,667 when annual weekly earnings are converted into a monthly figure.
The standardized food requirement of J$62,340.71 therefore represents approximately 84.6% of that monthly minimum-wage equivalent.
Jamaica: Food Requirement vs. Minimum-Wage Income
J$62,341 food requirement compared with approximately J$73,667 monthly minimum-wage equivalent.
In simple terms, a standardized minimum food budget consumes almost the entire monthly minimum-wage income benchmark.
That does not mean a minimum-wage worker actually spends J$62,341 every month on food.
It also does not mean the worker is necessarily supporting only one person.
The calculation is a standardized benchmark designed to measure the relative weight of food prices against income.
Now look at some other countries.
| Country | Food Basket as Share of Minimum-Wage Benchmark |
|---|---|
| Jamaica | 84.6% |
| Dominican Republic* | 78.3% |
| Peru | 56.3% |
| Mexico | 52.3% |
| Colombia | 48.3% |
| United States** | 34.2% |
| Canada** | 17.0% |
* The Dominican Republic has different minimum-wage levels by company size. The calculation uses the microenterprise benchmark of RD$16,993.20 per month.
** The United States and Canada figures use federal minimum-wage benchmarks, not a claim that every worker in those countries earns the federal rate. U.S. state and Canadian provincial or territorial minimum wages can be higher.
Food Requirement as Share of Minimum-Wage Income
Panama is deliberately left out of this exact percentage table.
That is not because Panama is unimportant.
It is because Panama’s minimum wage system contains numerous rates that vary by region, activity and occupation. Using one number and presenting it as a single national minimum wage would create a false sense of precision.
That distinction matters when doing serious comparisons.
And Jamaica Is Not Alone
The Jamaican figure is striking, but the wider picture is more complicated.
The Dominican Republic’s food requirement also takes a large share of its lower minimum-wage benchmark.
Peru’s position has changed somewhat because its statutory minimum wage increased to S/1,230 on October 1, 2026.
Mexico’s general minimum wage for 2026 is approximately Mex$9,582 per month, while Colombia’s 2026 statutory minimum is Col$1,750,905 per month.
Those figures make the Jamaican comparison particularly interesting.
Jamaica is not simply dealing with high supermarket prices. It is dealing with the relationship between those prices and the income floor available to workers.
Metric Five: What About the Average Worker?
Minimum wage is important, but it does not describe the earnings of the average worker.
That is why there is another useful benchmark: average monthly net salary after tax.
This is essentially the take-home pay figure reported in the international cost-of-living dataset.
When the standardized food requirement is measured against that income, Jamaica still stands out.
| Country | Average Net Salary | Food Requirement | Food Share |
|---|---|---|---|
| Jamaica | J$124,197.61 | J$62,340.71 | 50.2% |
| Colombia | Col$1,813,061.16 | Col$846,516.58 | 46.7% |
| Panama | US$824.51 | US$324.30 | 39.3% |
| Dominican Republic | RD$36,260.15 | RD$13,310.18 | 36.7% |
| Mexico | Mex$14,031.24 | Mex$5,012.36 | 35.7% |
| Peru | S/1,930.53 | S/692.91 | 35.9% |
| Canada | C$4,145.85 | C$534.48 | 12.9% |
| United States | US$4,318.74 | US$430.21 | 10.0% |
Food Requirement as Share of Average Net Salary
This may be the most revealing part of the entire comparison.
Using these benchmarks, the standardized food requirement represents roughly half of Jamaica’s average monthly take-home salary.
In Colombia it is about 46.7%.
In Panama it is about 39.3%.
In Mexico and Peru it is around 36%.
In the United States and Canada, the same standardized food requirement consumes a much smaller share of average take-home pay.
Again, this does not mean Americans or Canadians have cheap groceries.
They clearly do not.
It means their income levels are much higher relative to the cost of the standardized food basket.
Metric Six: The Travel Test
This is where the numbers connect back to the experiences Jamaicans have been describing.
A Jamaican traveller arriving in Colombia, Mexico, Peru, Panama or the Dominican Republic is not necessarily walking into a country where every single item is cheaper.
That would be too simplistic.
But the broader grocery data help explain why the experience can still feel dramatically different.
Colombia’s grocery index is less than half Jamaica’s.
Peru’s is substantially lower.
Mexico’s is also considerably lower.
Panama sits somewhere in the middle, while the Dominican Republic has a lower grocery index than Jamaica as well.
So when a Jamaican traveller says, “Why does this feel cheaper?” there is at least some broader price data behind the observation.
The traveller is still only seeing a small sample.
One supermarket in Medellín is not Colombia.
One supermarket in Cancún is not Mexico.
One restaurant in Lima is not Peru.
But when thousands of reported prices are aggregated across a country, the broader pattern becomes easier to examine.
Metric Seven: What About the United States and Canada?
This is where the story gets more interesting.
It would be wrong to turn this article into “Jamaica is cheaper than America” or “Jamaica is more expensive than Canada.”
Neither statement would be accurate across every product.
The United States has a grocery index of 76.38, higher than Jamaica’s 68.64.
Canada is at 69.18, also slightly above Jamaica.
So on the broad grocery index, the United States and Canada actually score higher.
Yet the income comparison tells a completely different story.
The standardized food requirement is about 50.2% of Jamaica’s average net salary in this comparison.
It is about 12.9% in Canada and 10.0% in the United States.
That is the point that can easily get lost when people compare supermarket prices internationally.
A country can have higher grocery prices but still have food that is more affordable relative to local earnings.
That is why affordability is not the same thing as price.
Why Can Another Country Produce Food More Cheaply?
This is one of the questions that naturally comes up when Jamaicans see lower prices abroad.
If Jamaica grows bananas, vegetables, fruits and other agricultural products, why should some of those products appear cheaper elsewhere?
Because producing something locally does not automatically make the final retail price low.
The final supermarket price can be affected by land costs, labour, electricity, fuel, transportation, refrigeration, packaging, financing, taxes, import costs, distribution networks, economies of scale and the size of the domestic market.
A farmer can produce a crop locally and still face high costs before that crop reaches a supermarket shelf.
There is also a major difference between producing something and producing it at large commercial scale.
A country with a much larger population and agricultural market can spread certain costs across millions of consumers.
That can make a meaningful difference in the final retail price.
But Jamaica Produces Food Too
This is where the conversation becomes more complicated.
Jamaica has a strong agricultural sector and produces many of the foods Jamaicans eat.
Yet domestic production does not mean Jamaica is insulated from international prices.
Farmers still need fertilizer, equipment, fuel, packaging, transportation and other inputs.
Some of those costs are themselves influenced by international markets.
Jamaica is also a relatively small market.
That can make it harder for local producers and retailers to achieve the same economies of scale available to much larger countries.
So the answer is not simply “Jamaica needs to grow more food.”
It is also a question of how efficiently food moves from farm to processor to distributor to retailer and finally to the consumer.
The Income Question Changes Everything
Imagine two countries where a grocery basket costs the equivalent of US$400.
In one country, the average worker takes home US$4,000 a month.
In the other, the average worker takes home US$1,000.
The basket has the same dollar value in the example.
But it does not have the same economic weight.
That is exactly why international price comparisons need an income component.
Looking only at the supermarket shelf tells us what something costs.
Looking at income tells us what that price actually means to the person buying it.
What the Numbers Really Tell Us
The data do not prove that Jamaica has the most expensive food in the world.
That would be an entirely different claim, and this analysis does not support it.
They also do not show that every item in Jamaica is more expensive than the equivalent item abroad.
They show something more specific.
Jamaica’s grocery-price environment is substantially higher than several countries Jamaicans commonly compare their shopping experiences with.
And once those prices are measured against local earnings, the difference becomes even more significant.
Jamaica’s standardized food requirement consumes approximately 84.6% of the country’s monthly minimum-wage equivalent in this comparison.
Against average take-home pay, it is approximately 50.2%.
That is the part of the story that deserves the most attention.
My Take
I think the most interesting thing about this comparison is that Jamaicans did not need a spreadsheet to notice something was happening.
People were already travelling and asking the question.
“How is this cheaper here?”
That is a legitimate question.
The numbers do not validate every individual traveller’s experience, because individual experiences can be affected by where someone shops, what they buy, exchange rates and temporary promotions.
But the broader data suggest that the feeling is not completely imaginary either.
Jamaica sits in an uncomfortable position.
Its grocery prices are not the highest on every international measure. The United States and Canada, for example, have higher grocery indexes in the 2026 mid-year comparison.
But Jamaica’s income levels are much lower.
That combination is what makes the issue particularly painful.
The question should therefore not simply be, “Why is milk J$600?”
The bigger question is, “How much of a Jamaican worker’s income does that J$600 represent?”
That is where a discussion about food prices becomes a discussion about living standards.
The Bottom Line
Jamaica’s food prices deserve to be looked at from more than one angle.
At the grocery-index level, Jamaica is considerably more expensive than Colombia, Peru, the Dominican Republic, Mexico and Panama in the 2026 mid-year comparison.
At the individual-item level, the picture is mixed. Some products are cheaper in Jamaica, while others are more expensive.
At the standardized food-basket level, Jamaica’s monthly requirement is substantial relative to local earnings.
And when that requirement is measured against minimum wages and average take-home salaries, Jamaica’s position becomes much more difficult to dismiss as simply a matter of perception.
So the next time a Jamaican comes home from Colombia, Mexico, Panama, Peru or the Dominican Republic and says, “Food was way cheaper over there,” there is a useful response.
Don’t just ask what they bought.
Ask what it cost.
Then ask what the average worker in that country earns.
That is where the real comparison begins.
Data note: This analysis uses 2026 international grocery and food-price data alongside 2026 statutory minimum-wage information from official government sources. Food prices and salary data can change over time and vary by city, retailer, product quality and household circumstances. The comparisons are intended as standardized benchmarks, not a claim that every household spends the same amount.